Logging And Monitoring
前言
Prerequistites
- Logging
- Monitoring
- Alerting
Elastic Search, Logstash, Kibana (ELK)
-
Elasticsearch 的核心是搜索引擎、採集管道Logstash 和可視化工具Kibana。
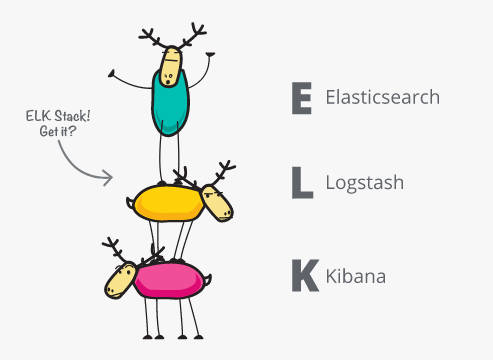
Elastic Search
Introduce
-
一個建置在 Apache Lucene 上的分散式搜尋和分析引擎,提供 near real-time 的數據搜尋與分析,能夠儲存複雜結構的數據
-
授權不是開放原始碼,也不向使用者提供相同的自由。因此引進了 OpenSearch 專案,此專案是一個社群驅動型 ALv2 許可的開放原始碼 Elasticsearch 和 Kibana 分支
-
列舉幾項應用場景:
- 網站或應用的 search box
- 儲存與分析 logs, metrics 等 structured 或 unstructured 文字進而找出安全漏洞
- 將 Elasticsearch 作為儲存引擎去自動化 workflows
- 將 Elasticsearch 作為 GIS 去整合與分析空間資料
- 將 Elasticsearch 作為生物訊息搜尋工具去儲存與處理基因資料
以資料流來簡易說明 Elasticsearch 8.6(current) 做的事情
-
documents and indices
- 儲存已序列化為 JSON 文檔的複雜數據結構
- 有多個 Elasticsearch 節點時,存儲的文檔分佈在集群中,並且可以從任何節點立即訪問
- 支援快速搜尋,因為使用了 “inverted index” 的數據結構,每種數據都有專屬並優化過的結構,如
- text fields are stored in inverted indices
- numeric and geo fields are stored in BKD trees
- 支援 schema-less,當不確定如何處理文檔中的字段時使用,需啟用 “dynamic mapping”
-
search and analyze
- 支援 structured queries, full text queries 以及結合兩種搜尋方式
- 除此之外,也有支援高性能地理空間與數值數據搜尋
- 透過 Elasticsearch’s comprehensive JSON-style query language (Query DSL) 可以去訪問這些搜尋功能
- 結合 JDBC 與 ODBC drivers 可以讓第三方 applications 更加廣泛地透過 SQL 與 Elasticsearch 互動
-
scalabilty and resilience
- Elasticsearch 可根據您的需求進行擴展,並且知道如何平衡多節點 cluster
- 運作方式
- 將 shards 分布到多個 nodes 上,利用確保冗餘 (redundancy) 可以達到防止 hardware failures 以及增加 query capacity (讀取請求的能力),當 nodes 數量增減,Elasticsearch 會自動遷移 shard 以重新平衡集群
- shard 有兩種 types
- primaries:
- Each document in an index belongs to one primary shard.
- 數量固定。
- replicas:
- a copy of a primary shard.
- 為了冗餘 (redundancy),可以達到防止 hardware failures 以及增加 query capacity (讀取請求的能力)。
- 數量可以更改。
- primaries:
Logstash
Introduce
- 一種開放原始碼資料擷取工具,可讓您從各種來源收集資料、轉換資料並將資料傳送到所需目的地。憑藉預先建置的篩選條件和對 200 多個外掛程式的支援,Logstash 可讓使用者輕鬆擷取資料,而不管資料來源或類型如何。
架構:
- 一個輸入,一個輸出,中間有個管道(不是必須的),這個管道用來收集、解析和轉換日誌的。
- three stages: inputs → filters → outputs
- Inputs generate events, filters modify them, and outputs ship them elsewhere.
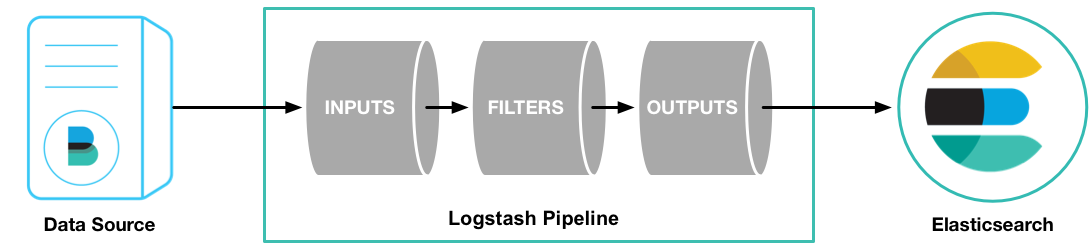
- 簡介 Inputs, Filters 與 Outputs
-
Inputs如 file, syslog, redis or beat- 參考這篇 configure Filebeat to send log lines to Logstash
-
Filters如 grok, mutate, drop, clone, geoip- grok: 解析與重組文字,Logstash 中用來解析非結構性的 log 的最好方式,可參考這篇
- mutate: 能夠 rename, remove, replace, and modify fields in your events
- drop: 完整剔除一個 event
- clone: 複製一個 event
- geoip: 加入一些新的資訊,如 IP 地址
-
Outputs如 elasticsearch, file, graphite, statsd-
elasticsearch: 放在這邊的優點是效率、方便且容易搜尋的
-
file: 寫入檔案內
-
graphite: 一個 open-source 的儲存時序資料與 render graphs 工具
- 根據官方文件介紹
Graphite does two things:
1.Store numeric time-series data
2.Render graphs of this data on demand
- 根據官方文件介紹
-
statsd:
- 用途是監控應用程式,方式是將 metrics 收集、儲存並建立對應的警報機制
- 原理是監聽 UDP (或 TCP) 的程式並收集數據,將數據傳送給其他應用程式。
- 重要概念
- bucket: 每個 stat 擁有自己的 bucket
- value: 每個 stat 擁有一個 value,通常是 integer
- type: 指定 c (用於計數器)、g (用於測量儀)、ms (用於計時器)、h (用於長條圖) 或 s (用於 set)
- 官方文件
-
-
Codecs plugins
- 可在 input 或者 output 流程去更改數據顯示的格式
- codec-plugins
-
整合多種 data source
- 參考這篇範例, conf 檔設定值應如下:
input {
    twitter {
        consumer_key => "enter_your_consumer_key_here"
        consumer_secret => "enter_your_secret_here"
        keywords => ["cloud"]
        oauth_token => "enter_your_access_token_here"
        oauth_token_secret => "enter_your_access_token_secret_here"
    }
    beats {
        port => "5044"
    }
}
output {
    elasticsearch {
        hosts => ["IP Address 1:port1", "IP Address 2:port2", "IP Address 3"]
    }
    file {
        path => "/path/to/target/file"
    }
}
Kibana
- 一種用於檢視日誌和事件的資料視覺化和探索工具。Kibana 提供易於使用的互動式圖表、預先建置的彙總和篩選條件以及地理空間支援
Introduce
- 一種用於檢視日誌和事件的資料視覺化和探索工具。Kibana 提供易於使用的互動式圖表、預先建置的彙總和篩選條件以及地理空間支援
- 透過 kibana 能做到:
- 透過搜尋與觀察你的數據進而找出安全漏洞
- 分析與視覺化你的數據
- 管理數據、監測 Elastic Stack cluster 健康程度與權限控管
Kibana Query Language (KQL)
- only filters data, and has no role in aggregating, transforming, or sorting data
- filter documents where a value for a field exists, matches a given value, or is within a given range
- example
-
filter for documents where the http.request.method is GET, use the following query:
http.request.method: GET -
search for all documents for which http.response.bytes is less than 10000:
http.response.bytes < 10000 -
filter documents where the http.request.method is not GET, use the following query:
**NOT** http.request.method: GET -
find documents where a single value inside the user array contains a first name of “Alice” and last name of “White”, use the following:
user:{ first: "Alice" and last: "White" }
-
Lucene query syntax
- regular expressions or fuzzy term matching
- Lucene syntax is not able to search nested objects or scripted fields.
- example
-
find entries that have 4xx status codes and have an extension of php or html:
status:[400 TO 499] AND (extension:php OR extension:html)
-
Prometheus
介紹
- open-source systems monitoring and alerting toolkit
- Cloud Native Computing Foundation (CNCF) in 2016 as the second hosted project
- NOTE: 第一個被 CNCF hosted 的 project 是 kubernetes
- collects and stores its metrics as time series data
優點
- recording any purely numeric time series
- support for multi-dimensional data collection and querying
- Prometheus server is standalone, not depending on network storage or other remote services
缺點
- 不適合需要 100% accuracy 的服務
功能
- a multi-dimensional data model with time series data identified by metric name and key/value pairs
- PromQL, a flexible query language to leverage this dimensionality
- no reliance on distributed storage; single server nodes are autonomous
- time series collection happens via a pull model over HTTP
- pushing time series is supported via an intermediary gateway
- targets are discovered via service discovery or static configuration
- multiple modes of graphing and dashboarding support
metrics 介紹
- metrics are numeric measurements
- Metrics play an important role in understanding why your application is working in a certain way.
- 支援四種 metrics types, 這篇有更詳細的介紹
-
Counter - only increase or reset
-
Gauge - 使用情境如計算 number of pods in a cluster, number of events in an queue
-
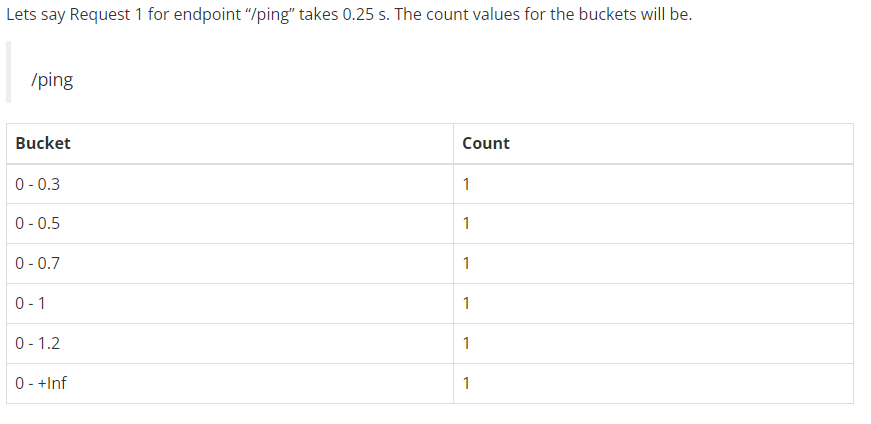
Histogram - 使用情境可以是任何需要計算的值,如 API requests 所花費的時間,Histogram 會將數據存在 buckets 中,會先定義 buckets - lower or equal 0.3 , le 0.5, le 0.7, le 1, and le 1.2,接著計算完每次 request 所花費的時間後可以將對應到 bucket 的 count 加一,如下圖
-
Summary - Histogram 的替代方案,因為更便宜,但付出的代價是 lose more data,原理是計算 metrics 的層級是 application level,所以當同一個 process 有諸多 instances 的話會無法計算
-
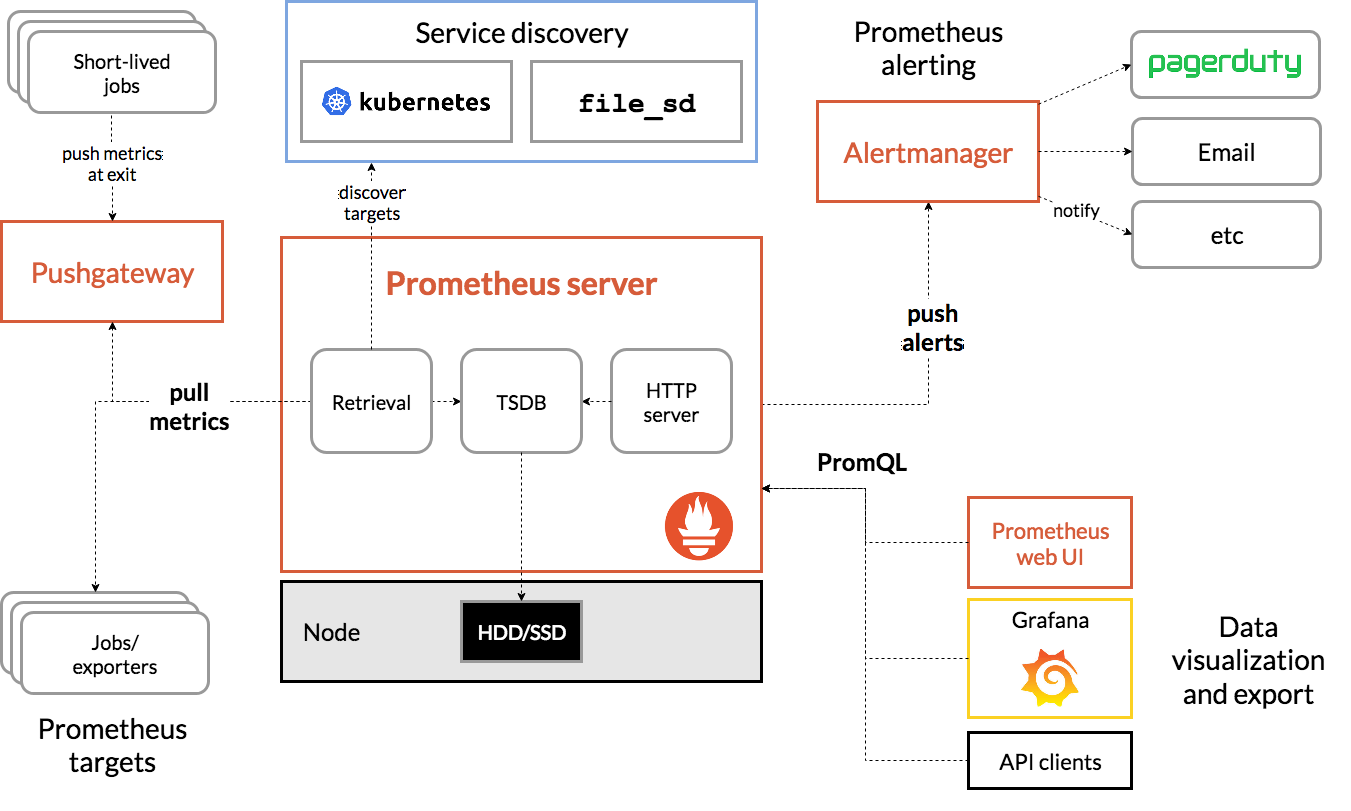
Components
- the main Prometheus server which scrapes and stores time series data
- client libraries for instrumenting application code
- a push gateway for supporting short-lived jobs
- special-purpose exporters for services like HAProxy, StatsD, Graphite, etc.
- an alertmanager to handle alerts
- various support tools
Grafana
介紹
- Grafana Labs 開發的 open-source 專案之一,還有其他專案,如 Grafana Loki (Like Prometheus, but for logs!), Grafana k6 (load testing tool)…
- query, visualize, alert on, and explore your metrics, logs, and traces wherever they are stored.
功能
Explore metrics, logs, and traces
- 以 RBAC ( Role-based access Control ) 來決定誰能夠 explore 這些數據
- 利用以下功能來查詢到更多數據趨勢與細節,細節參考這篇
- query management in explore
- logs integration in explore
- trace integration in explore
- inspector in explore: 目的是 troubleshoot 你的 queries,可以將數據導出至 csv 檔案,logs 導出至 txt 檔案
Alerts
- 參考這篇去建立 alert rules,包含設定 threshold, interval, duration
- 「 缺少數據」也能被設定 alert 行為
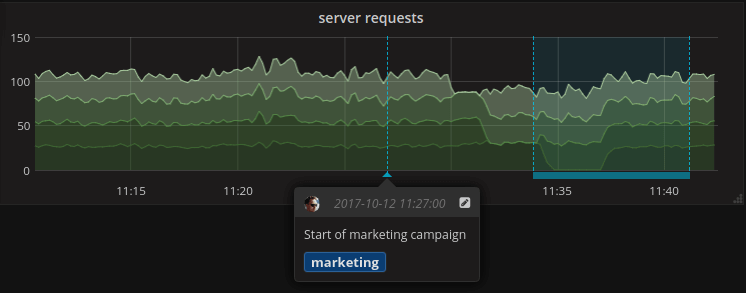
Annotations
- Hover over events to see the full event metadata and tags.
- 參考這篇可進行 Add annotation, Add region annotation, Edit annotation, Delete annotation, Built-in query, Query by tag 等功能
Grafana provides many ways to authenticate users
- 預設是提供 password authentication,其他詳細請看這篇
參考資料 👐
- what is elk stack
- Elasticsearch Service Documentation
- what-is-elasticsearch
- How Logstash Works | Logstash Reference [8.6] | Elastic
- elasticsearch introduction
- kibana introduction
- Overview | Prometheus
- Grafana documentation | Grafana documentation
🍀 若喜歡我的分享,可以幫我拍拍手👏,是對我最大的鼓勵